Unplugged activities: Difference between revisions
David Sousa (talk | contribs) |
David Sousa (talk | contribs) |
||
| Line 7: | Line 7: | ||
A person positions herself in the space before an audience, between two points A and B. The audience starts clapping similarly to a car parking system beeping sound, with clapping frequency proportional to the position of the person between the two points. | A person positions herself in the space before an audience, between two points A and B. The audience starts clapping similarly to a car parking system beeping sound, with clapping frequency proportional to the position of the person between the two points. | ||
This is a good moment to introduce students to | This is a good moment to introduce students to diffrent types of variables: | ||
'''Binary variables''': These are the simplest variables that basically give an ON/OFF information. | '''Binary variables''': These are the simplest variables that basically give an ON/OFF information. | ||
Revision as of 15:09, 26 July 2024
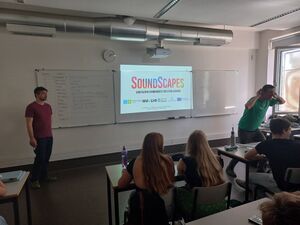
As a first approach to a class of students or another audience who are new to the sonification process, and also to digital tools, it is important to introduce some games and activities based on personal human-to-human communication. This will help break the ice within a group of students for them to understand the fundamental concepts of the sonification workflow, and create a positive and relaxed atmosphere that will help in the following steps. It also allows us to explain and apply the core concepts of a sonification system (it must be composed of one input data, one output sound, and a relation (protocol/mapping) between them). We can use the clapping as an output sound. Its rhythm can easily be modulated. Real instruments would be welcome.
Example 1: sonifying a person's position in a trajectory

A person positions herself in the space before an audience, between two points A and B. The audience starts clapping similarly to a car parking system beeping sound, with clapping frequency proportional to the position of the person between the two points.
This is a good moment to introduce students to diffrent types of variables:
Binary variables: These are the simplest variables that basically give an ON/OFF information.
Example: In a scenario where someone is in front of a crowd, people clap to indicate that the person is 'on' or present. Conversely, if someone is not on stage, they are not clapping.
Single variable with a range: it represents a quantity with values from a minimum to a maximum.
Example: sonify the position of a student moving along a line, between points A and B.
- Divide the class into two groups: (1) “active sound generators” and (2) “listeners”
- The students of group 2 look at the moving student and clap “more or less” (let them decide what that means) depending on the proximity of the student to point A or point B,
- The students of group (2) evaluate the result of clapping without visual contact of the moving student.
The purpose is to make the students think and discuss about all the details that a sonification system has to take into account.
The experiment can be developed. For example:
- A student from group 2 can reproduce the movement of the moving student according to the clapping coming from group 1 (thus evaluating the sonification information).
- His/her classmates can try to help him/her, through verbal contact, to refine the position using only their ears.
- The teacher can asks the class to freeze at a particular moment ask the two groups to evaluate their positions.
- Groups’ role interchanges.
Other modifications to this example can be done, i.e. the clapping can be performed by a single person, or by many to emphasize two concepts: 1) the protocol is subjective and 2) many sounds together generate confusion (“noise”).
Example 2

Start by asking your students what spring, summer, autumn, or winter sounds like? Brainstorm sounds that determine a season, perhaps precipitation, temperature, wind speed?
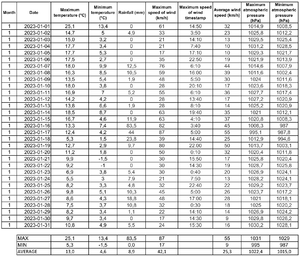
Provide the students with a table with data on temperature, precipitation, atmospheric pressure, wind speed, and other data that you consider relevant for sounding a station. You can provide the daily data for a specific year in your region.
Students will have to analyze this data and reflect on the following questions: how can this data be represented? Maybe the idea comes up to represent this information with graphs, in a visual way, but, how can this data be encoded with sound?
Having done the introduction and thought about how to sonify this data, let's get down to work.
- Data collection and analysis. Students should take the most important features and data to represent the seasons. They should choose only the data for a particular season, or perhaps be encouraged to sonify the data for a whole year, thus showing all four seasons. They can choose to sonify each value of the table (one per day) or make monthly averages or by fortnights. Let them experiment and see what is most representative for interpreting the data. They should also choose the variables to sonify the season, e.g. temperature and atmospheric pressure.
- Organize the data. Students must organize the selected data, identify patterns, and define how to represent them with different sounds and instruments. Students can choose to play a variable when its value is higher or lower than a certain threshold value or play a sound that gets louder when the values are higher. Students can define the maximum and minimum values for each feature, make monthly averages, or create scales of values that will then represent different sounds. They can play with volume, pitch, and timbre to sonify the range of values. Encourage them to use their body (clapping, voice) or use items around them (a table, a pen with a bottle) as instruments. Remember that this is an unplugged activity, no digital device will be used for data collection, analysis, or reproduction.
- Create the algorithm to sonify a season. Students have to create the composition based on the selected data. At this point, students must define the mapping protocol. To do so, they must create the algorithm that associates certain sounds to defined data, i.e. create the set of rules by which the output sounds correspond to the input data assigning to each value or range of values an instrument, pitch, loudness, timbre, and rhythm.
- Time to perform! Once the composition has been created and rehearsed, it is time to perform it and share it with the rest of the class. Can you guess what season it is, what variables you have sounded, is it a season with a lot of rain and low temperatures or are temperatures on the rise?
Enjoy the results, go back to the previous steps to improve the sonification if necessary and experiment with new variables and ways of representing them.
Finally, you can bring to the classroom The Four Seasons composition, a group of four violin concerti by Italian composer Antonio Vivaldi, each of which gives musical expression to a season of the year. Will you be able to guess which one it is? What data is represented in this composition? The composition includes accompanying poems describing what Vivaldi wanted to represent in relation to each of the seasons, find out more information and discover it for yourself!